Free Online Productivity Tools
i2Speak
i2Symbol
i2OCR
iTex2Img
iWeb2Print
iWeb2Shot
i2Type
iPdf2Split
iPdf2Merge
i2Bopomofo
i2Arabic
i2Style
i2Image
i2PDF
iLatex2Rtf
Sci2ools
APVIS
2010
2010
Visual analysis of high dimensional point clouds using topological landscapes
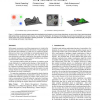
In this paper, we present a novel three-stage process to visualize the structure of point clouds in arbitrary dimensions. To get insight into the structure and complexity of a data set, we would most preferably just look into it, e.g. by plotting its corresponding point cloud. Unfortunately, for orthogonal scatter plots, this only works up to three dimensions, and other visualizations, like parallel coordinates or scatterplot matrices, also have problems handling many dimensions and visual overlap of data entities. The presented solution tackles the problem of visualizing point clouds indirectly by visualizing the topology of their density distribution. The benefit of this approach is that this topology can be computed in arbitrary dimensions. Similar to examining scatter plots, this gives the important information like the number, size and nesting structure of accumulated regions. We view our approach as an alternative to cluster visualization. To create the visualization, we first e...
| Added | 12 May 2011 |
| Updated | 12 May 2011 |
| Type | Journal |
| Year | 2010 |
| Where | APVIS |
| Authors | Patrick Oesterling, Christian Heine, Heike Jänicke, Gerik Scheuermann |
Comments (0)

