439 search results - page 24 / 88 » Visualizing Graphs and Clusters as Maps |
ECML
2006
Springer
13 years 10 months ago
2006
Springer
We propose preprocessing spectral clustering with b-matching to remove spurious edges in the adjacency graph prior to clustering. B-matching is a generalization of traditional maxi...
APVIS
2009
13 years 9 months ago
2009
Many graphs used in real-world applications consist of nodes belonging to more than one category. We call such graph "multiplecategory graphs". Social networks are typic...
APVIS
2001
13 years 9 months ago
2001
This paper demonstrates the application of graph drawing and information visualisation techniques to the visualisation of information which can be modelled as an attributed graph....
ICDM
2003
IEEE
14 years 1 months ago
2003
IEEE
Clustering is an important technique for understanding and analysis of large multi-dimensional datasets in many scientific applications. Most of clustering research to date has be...
MM
2009
ACM
14 years 3 months ago
2009
ACM
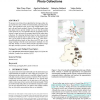
We present a novel data-driven algorithm that leverages online image repositories such as Flickr for automatically generating tourist maps. Our hypothesis is that, given a large e...


