115
click to vote
CANDC
2009
ACM
15 years 8 months ago
2009
ACM
Data visualization, commonly used to make large sets of numerical data more legible, also has enormous potential as a storytelling tool to elicit insights on long-standing social ...
113
click to vote
TEI
2010
ACM
15 years 9 months ago
2010
ACM
In this paper, I propose that visualization should escape the traditional constraint of the screen and embrace the physical environment to realize more tangible interactions for m...
102
click to vote
CHI
2007
ACM
16 years 2 months ago
2007
ACM
Information shown on a tabletop display can appear distorted when viewed by a seated user. Even worse, the impact of this distortion is different depending on the location of the ...
117
click to vote
CHI
2008
ACM
16 years 2 months ago
2008
ACM
We present LiveRAC, a visualization system that supports the analysis of large collections of system management timeseries data consisting of hundreds of parameters across thousan...
145
click to vote
CHI
2008
ACM
16 years 2 months ago
2008
ACM
Many Eyes is a web site that provides collaborative visualization services, allowing users to upload data sets, visualize them, and comment on each other's visualizations. Th...
116
click to vote
CHI
2009
ACM
16 years 2 months ago
2009
ACM
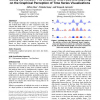
We investigate techniques for visualizing time series data and evaluate their effect in value comparison tasks. We compare line charts with horizon graphs--a space-efficient time ...


