Free Online Productivity Tools
i2Speak
i2Symbol
i2OCR
iTex2Img
iWeb2Print
iWeb2Shot
i2Type
iPdf2Split
iPdf2Merge
i2Bopomofo
i2Arabic
i2Style
i2Image
i2PDF
iLatex2Rtf
Sci2ools
102
click to vote
APVIS
2010
2010
Visualizing field-measured seismic data
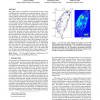
This paper presents visualization of field-measured, time-varying multidimensional earthquake accelerograph readings. Direct volume rendering is used to depict the space-time relationships of seismic readings collected from sensor stations in an intuitive way such that the progress of seismic wave propagation of an earthquake event can be directly observed. The resulting visualization reveals the sequence of seismic wave initiation, propagation, attenuation over time, and energy releasing events. We provide a case study on the magnitude scale Mw 7.6 Chi-Chi earthquake in Taiwan, which is the most thoroughly recorded earthquake event ever in the history. More than 400 stations recorded this event, and the readings from this event increased global strong-motion records five folds. Each station measured east-west, north-south, and vertical component of acceleration for approximately 90 seconds. The sensor network released the initial raw data within minutes after the ChiChi mainshock. It...
APVIS 2010 | Earthquake Event | Information Technology | Seismic Wave | Time-varying Multidimensional Earthquake |
Related Content
| Added | 29 Oct 2010 |
| Updated | 29 Oct 2010 |
| Type | Conference |
| Year | 2010 |
| Where | APVIS |
| Authors | Tung-Ju Hsieh, Cheng-Kai Chen, Kwan-Liu Ma |
Comments (0)

