Free Online Productivity Tools
i2Speak
i2Symbol
i2OCR
iTex2Img
iWeb2Print
iWeb2Shot
i2Type
iPdf2Split
iPdf2Merge
i2Bopomofo
i2Arabic
i2Style
i2Image
i2PDF
iLatex2Rtf
Sci2ools
112
click to vote
CGF
2008
2008
Interactive Visualization of Multimodal Volume Data for Neurosurgical Tumor Treatment
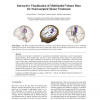
Teaser Figure: Left: Brain, visualized using silhouettes, the lesion's spatial depth is displayed using a ring. Center: Combined rendering of brain tissue, skull and fiber tracts using a cutting plane. Right: The virtual path (cyan) from the entry point to the region of interest. The two crossed lines represent the diameter of the virtual cylinder. We present novel interactive methods for the visualization of multimodal volume data as used in neurosurgical therapy planning. These methods allow surgeons to explore multimodal volumes and focus on functional data and lesions. Computer graphics techniques are proposed to create expressive visualizations at interactive frame rates to reduce time-consuming and complex interaction with the medical data. Contributions of our work are the distance-based enhancements of functional data and lesions which allows the surgeon to perceive functional and anatomical structures at once and relate them directly to the intervention. In addition we p...
| Added | 09 Dec 2010 |
| Updated | 09 Dec 2010 |
| Type | Journal |
| Year | 2008 |
| Where | CGF |
| Authors | Christian Rieder, Felix Ritter, Matthias Raspe, Heinz-Otto Peitgen |
Comments (0)

