Free Online Productivity Tools
i2Speak
i2Symbol
i2OCR
iTex2Img
iWeb2Print
iWeb2Shot
i2Type
iPdf2Split
iPdf2Merge
i2Bopomofo
i2Arabic
i2Style
i2Image
i2PDF
iLatex2Rtf
Sci2ools
CORR
2016
Springer
2016
Springer
Distinct 3D Glyphs with Data Layering for Highly Dense Multivariate Data Plots
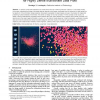
—A carefully constructed scatterplot can reveal plenty about an underlying data set. However, in most cases visually mining and understanding a large multivariate data set requires more finesse, and greater level of interactivity to really grasp the full spectrum of the information being presented. We present a paradigm for glyph design and use in the creation of single plots presenting multiple variables of information. We center our design on two key concepts. The first concept is that visually it is easier to discriminate between completely distinct shapes rather than subtly different ones, specially when partially occluded. The second one is that users ingest information in layers, i.e. in an order of visual relevance. Using this paradigm, we present complex data as binned into desired and relevant discrete categories. We show results in the areas of high energy physics and security, displaying over 6 distinct data variables in each single plot, yielding a clear, highly readable,...
| Added | 31 Mar 2016 |
| Updated | 31 Mar 2016 |
| Type | Journal |
| Year | 2016 |
| Where | CORR |
| Authors | Santiago V. Lombeyda |
Comments (0)

