Free Online Productivity Tools
i2Speak
i2Symbol
i2OCR
iTex2Img
iWeb2Print
iWeb2Shot
i2Type
iPdf2Split
iPdf2Merge
i2Bopomofo
i2Arabic
i2Style
i2Image
i2PDF
iLatex2Rtf
Sci2ools
127
click to vote
VISUALIZATION
2000
IEEE
2000
IEEE
Fast visualization methods for comparing dynamics: a case study in combustion
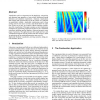
Visualization can be an important tool for displaying, categorizing and digesting large quantities of inter-related information during laboratory and simulation experiments. Summary visualizations that compare and represent data sets in the context of a collection are particularly valuable. Applicable visualizations used in these settings must be fast (near real time) and should allow the addition of data sets as they are acquired without requiring rerendering of the visualization. This paper examines several visualization techniques for representing collections of data sets in a combustion experiment including spectral displays, tiling and geometric mappings of symmetry. The application provides insight into how such visualizations might be used in practical real-time settings to assist in exploration and in conducting parameter space surveys.
Applicable Visualizations | Data Sets | Summary Visualizations | Visualization | VISUALIZATION 2000 |
Related Content
| Added | 01 Aug 2010 |
| Updated | 01 Aug 2010 |
| Type | Conference |
| Year | 2000 |
| Where | VISUALIZATION |
| Authors | Kay A. Robbins, Michael Gorman |
Comments (0)

