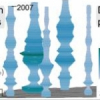
224 search results - page 1 / 45 » 3D Visualization of Multiple Time Series on Maps |
Publication
Abstract—In the analysis of spatially-referenced timedependent
data, gaining an understanding of the spatiotemporal
distributions and relationships among the attributes
in the...
ISVC
2009
Springer
14 years 3 months ago
2009
Springer
Abstract. One challenge associated with the visualization of time-dependent data is to develop graphical representations that are effective for exploring multiple time-varying qua...
IV
2010
IEEE
13 years 9 months ago
2010
IEEE
We propose an interactive framework for the 3D visualization of the time-series of Web graphs. The purpose of our framework is to enable users to examine the evolution of Web grap...
IV
2005
IEEE
14 years 4 months ago
2005
IEEE
The visual analysis of time dependent data is an essential task in many application fields. However, visualizing large time dependent data collected within a spatial context is st...
AMFG
2007
IEEE
14 years 5 months ago
2007
IEEE
Abstract. 3D face tracking is an important component for many computer vision applications. Most state-of-the-art tracking algorithms can be characterized as being either intensity...


