277 search results - page 36 / 56 » 3D Information Visualization for Time Dependent Data on Maps |
ISMAR
2008
IEEE
14 years 2 months ago
2008
IEEE
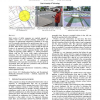
Field workers of utility companies are regularly engaged in outdoor tasks such as network planning, maintenance and inspection of underground infrastructure. Redlining is the term...
MM
2003
ACM
14 years 29 days ago
2003
ACM
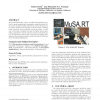
We present MuSA.RT, Opus 1, a multimodal interactive system for music analysis and visualization using the Spiral Array model. Real-time MIDI input from a live performance is proc...
ICDE
2009
IEEE
14 years 9 months ago
2009
IEEE
A sensor network data gathering and visualization infrastructure is demonstrated, comprising of Global Sensor Networks (GSN) middleware and Microsoft SensorMap. Users are invited t...
IEEECGIV
2007
IEEE
14 years 2 months ago
2007
IEEE
Detecting change of remote sensing images is very important for some applications such as tracking of moving objects and motion estimation. Traditional work on change detection ha...
TVCG
2011
13 years 2 months ago
2011
—Direct volume rendering is an important tool for visualizing complex data sets. However, in the process of generating 2D images from 3D data, information is lost in the form of ...


