407 search results - page 37 / 82 » A Lattice Model for Data Display |
ITICSE
1996
ACM
14 years 1 days ago
1996
ACM
The operation of a computer can be conceptualised as a large, discrete and constantly changing set of state information. However even for the simplest uni-processor the data set o...
3DPVT
2004
IEEE
13 years 11 months ago
2004
IEEE
Archaeology is a destructive process in which accurate and detailed recording of a site is imperative. As a site is exposed, documentation is required in order to recreate and und...
VIS
2005
IEEE
14 years 9 months ago
2005
IEEE
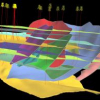
In this paper, we present a volume roaming system dedicated to oil and gas exploration. Our system combines probebased volume rendering with data processing and computing. The dai...
GPB
2010
13 years 5 months ago
2010
The detection of genes that show similar profiles under different experimental conditions is often an initial step in inferring the biological significance of such genes. Visualiz...
GLOBECOM
2007
IEEE
14 years 2 months ago
2007
IEEE
—In this paper, we clarify inter-link interference in wireless ad-hoc networks by using link-directional interference graphs (l-graph). Most of the interference graphs in the lit...


