1145 search results - page 96 / 229 » An Interactive Visual Query Environment for Exploring Data |
160
click to vote
VIS
2009
IEEE
16 years 7 days ago
2009
IEEE
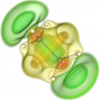
Simulation and computation in chemistry studies have been improved as computational power has increased over decades. Many types of chemistry simulation results are available, from...
100
click to vote
GI
2009
Springer
15 years 4 days ago
2009
Springer
Abstract: Research in the field of academic teaching and life focuses on the integration of recent technologies. Additionally, new trends within the current usage of e.g. the Inter...
137
click to vote
AP2PC
2003
Springer
15 years 7 months ago
2003
Springer
Peer-to-Peer (P2P) technologies promise to provide efficient distribution, sharing and management of resources, such as storage, processing, routing and other sundry service capabi...
131
click to vote
CGF
2010
15 years 2 months ago
2010
Kinematics is the analysis of motions without regarding forces or inertial effects, with the purpose of understanding joint behaviour. Kinematic data of linked joints, for example...
139
click to vote
BMCBI
2006
15 years 2 months ago
2006
Background: Many commonly used genome browsers display sequence annotations and related attributes as horizontal data tracks that can be toggled on and off according to user prefe...


