3499 search results - page 650 / 700 » Informal User Interface for Graphical Computing |
104
click to vote
PG
2003
IEEE
15 years 7 months ago
2003
IEEE
Interactive data visualization is inherently an iterative trial-and-error process searching for an ideal set of parameters for classifying and rendering features of interest in th...
110
Voted
VISSYM
2007
15 years 4 months ago
2007
Time series are a data type of utmost importance in many domains such as business management and service monitoring. We address the problem of visualizing large time-related data ...
125
click to vote
CGF
2008
15 years 2 months ago
2008
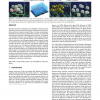
Color is widely used in data visualization to show data values. The proper selection of colors is critical to convey information correctly. In this paper, we present a technique f...
126
click to vote
INFOVIS
2005
IEEE
15 years 8 months ago
2005
IEEE
In order to gain insight into multivariate data, complex structures must be analysed and understood. Parallel coordinates is an excellent tool for visualizing this type of data bu...
164
click to vote
SIGGRAPH
2010
ACM
15 years 6 months ago
2010
ACM
Repeated elements are ubiquitous and abundant in both manmade and natural scenes. Editing such images while preserving the repetitions and their relations is nontrivial due to over...


