1225 search results - page 81 / 245 » Interaction Spaces in Data and Information Visualization |
MM
2003
ACM
14 years 2 months ago
2003
ACM
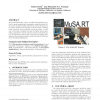
We present MuSA.RT, Opus 1, a multimodal interactive system for music analysis and visualization using the Spiral Array model. Real-time MIDI input from a live performance is proc...
CGF
2008
13 years 9 months ago
2008
In many business applications, large data workloads such as sales figures or process performance measures need to be monitored in real-time. The data analysts want to catch proble...
VIS
2009
IEEE
14 years 7 months ago
2009
IEEE
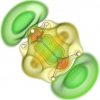
Simulation and computation in chemistry studies have been improved as computational power has increased over decades. Many types of chemistry simulation results are available, from...
IV
2007
IEEE
14 years 3 months ago
2007
IEEE
Geovisualization (GeoViz) is an intrinsically complex process. The analyst needs to look at data from various perspectives and at various scales, from “seeing the whole” to �...
CHI
2005
ACM
13 years 11 months ago
2005
ACM
Motion is the strongest visual appeal to attention [2], yet it is rarely used in the visualization of large-scale quantitative information. Motion is complex; it can vary across n...


