268 search results - page 31 / 54 » Interactive Visualization of Genealogical Graphs |
INTERACT
2007
15 years 3 months ago
2007
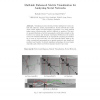
Abstract. Visualizing social networks presents challeges for both nodelink and adjacency matrix representations. Social networks are locally dense, which makes node-link displays u...
118
Voted
VISUALIZATION
1997
IEEE
15 years 6 months ago
1997
IEEE
We introduce the contour spectrum, a user interface component that improves qualitative user interaction and provides real-time exact quanti cation in the visualization of isocont...
126
Voted
CGF
2010
15 years 2 months ago
2010
This paper presents a digital storytelling approach that generates automatic animations for time-varying data visualization. Our approach simulates the composition and transition ...
130
Voted
IV
2007
IEEE
15 years 8 months ago
2007
IEEE
This paper presents a novel technique for exploring and navigating large hierarchies, not restricted to trees but to directed acyclic graphs (dags). The technique combines two dif...
123
Voted
CSMR
2000
IEEE
15 years 7 months ago
2000
IEEE
Shimba, a prototype reverse engineering environment, has been built to support the understanding of Java software. Shimba uses Rigi and SCED to analyze, visualize, and explore the...


