2002 search results - page 9 / 401 » Interactive technical illustration |
SIGGRAPH
2010
ACM
13 years 12 months ago
2010
ACM
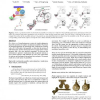
How things work visualizations use a variety of visual techniques to depict the operation of complex mechanical assemblies. We present an automated approach for generating such vi...
CHI
2009
ACM
14 years 8 months ago
2009
ACM
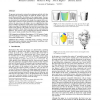
Scientists, engineers, and educators commonly need to make graphs that quickly illustrate quantitative ideas yet are not based on specific data sets. We call these graphs quantita...
SIGGRAPH
1997
ACM
13 years 11 months ago
1997
ACM
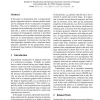
We present an interactive system for creating pen-and-ink-style line drawings from greyscale images in which the strokes of the rendered illustration follow the features of the or...
VMV
2004
13 years 8 months ago
2004
In this paper we demonstrate how a computational physics approach based on a discrete particle model can be employed for the visualization of magnetic field lines. This can be reg...
AVI
2008
13 years 8 months ago
2008
In many interactive scenarios, the fast recognition and localization of crucial information is very important to effectively perform a task. However, in information visualization...


