1965 search results - page 2 / 393 » Layered Design Visualisation |
IV
2002
IEEE
15 years 7 months ago
2002
IEEE
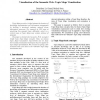
Topic Maps provide a bridge between the domains of knowledge representation and information management by building a structured semantic network above information resources. Our r...
124
Voted
IHM
2009
ACM
15 years 8 months ago
2009
ACM
In this article, we are interested in information visualisations creation and sharing. Our approach is to consider information visualisation as a dataflow, issued from web servic...
122
Voted
AVI
2006
15 years 3 months ago
2006
This paper presents an analysis of user studies from a review of papers describing new visualisation applications and uses these to highlight various issues related to the evaluat...
130
click to vote
JDA
2010
15 years 19 days ago
2010
: Hierarchical graphs are graphs with layering structures; clustered graphs are graphs with recursive clustering structures. Both have applications in VLSI design, CASE tools, soft...
117
Voted
APVIS
2004
15 years 3 months ago
2004
Discrete 2D survey data is common in the areas of business, science and government. Visualisation is often used to present such data. The best form of visualisation depends on how...


