7465 search results - page 1482 / 1493 » Point-based Computer graphics |
104
click to vote
CCR
2008
15 years 2 months ago
2008
Despite the flurry of anomaly-detection papers in recent years, effective ways to validate and compare proposed solutions have remained elusive. We argue that evaluating anomaly d...
124
click to vote
CGF
2008
15 years 2 months ago
2008
DNA microarrays are used to measure the expression levels of thousands of genes simultaneously. In a time series experiment, the gene expressions are measured as a function of tim...
115
click to vote
CGF
2008
15 years 2 months ago
2008
In many business applications, large data workloads such as sales figures or process performance measures need to be monitored in real-time. The data analysts want to catch proble...
113
click to vote
CGF
2008
15 years 2 months ago
2008
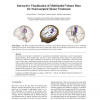
Teaser Figure: Left: Brain, visualized using silhouettes, the lesion's spatial depth is displayed using a ring. Center: Combined rendering of brain tissue, skull and fiber tr...
119
click to vote
CGF
2008
15 years 2 months ago
2008
Many casually taken "tourist" photographs comprise of architectural objects like houses, buildings, etc. Reconstructing such 3D scenes captured in a single photograph is...


