1311 search results - page 34 / 263 » The Visualization Process: The Path from Data to Insight |
BMCBI
2011
13 years 2 months ago
2011
Background: Broad-based collaborations are becoming increasingly common among disease researchers. For example, the Global HIV Enterprise has united cross-disciplinary consortia t...
CGF
2008
13 years 8 months ago
2008
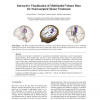
Teaser Figure: Left: Brain, visualized using silhouettes, the lesion's spatial depth is displayed using a ring. Center: Combined rendering of brain tissue, skull and fiber tr...
APVIS
2009
13 years 9 months ago
2009
Many graph visualization systems use graph hierarchies to organize a large input graph into logical components. These approaches detect features globally in the data and place the...
IJCNN
2006
IEEE
14 years 1 months ago
2006
IEEE
—Event-related potentials (ERPs) recorded at the scalp are indicators of brain activity associated with eventrelated information processing; hence they may be suitable for the as...
GIS
2007
ACM
14 years 9 months ago
2007
ACM
This research reports on exploring analytical methodologies for spatio-temporal data of pedestrian egress dynamics in a crowded environment. The research objective is to spatially...


