213 search results - page 5 / 43 » Visual Clustering in Parallel Coordinates |
DIS
2006
Springer
14 years 1 months ago
2006
Springer
Paleoclimatology requires the analysis of paleo time-series, obtained from a number of independent techniques and instruments, produced by several researchers and/or laboratories. ...
VIS
2009
IEEE
14 years 11 months ago
2009
IEEE
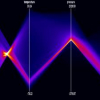
Typical scientific data is represented on a grid with appropriate interpolation or approximation schemes, defined on a continuous domain. The visualization of such data in parallel...
VIS
2008
IEEE
14 years 11 months ago
2008
IEEE
Parallel coordinate plots (PCPs) are commonly used in information visualization to provide insight into multi-variate data. These plots help to spot correlations between variables....
CGF
2011
13 years 1 months ago
2011
High-dimensional data visualization is receiving increasing interest because of the growing abundance of highdimensional datasets. To understand such datasets, visualization of th...
INFOVIS
2002
IEEE
14 years 2 months ago
2002
IEEE
In this paper we present several extensions to the wellknown InfoViz technique of parallel coordinates, mainly concentrating on brushing and focus+context visualization. First, we...


