1119 search results - page 60 / 224 » Visual Comparison of Graphical Models |
116
click to vote
VISUALIZATION
2000
IEEE
15 years 6 months ago
2000
IEEE
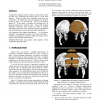
Visualization techniques enable scientists to interactively explore 3D data sets, segmenting and cutting them to reveal inner structure. While powerful, these techniques suffer fr...
140
click to vote
BMCBI
2011
14 years 9 months ago
2011
Background: The accurate determination of orthology and inparalogy relationships is essential for comparative sequence analysis, functional gene annotation and evolutionary studie...
MVA
1992
15 years 3 months ago
1992
This paper describes a method to perform distance measurements inside buildings using a single video camera mounted on a mobile robot. This algorithm is designed specifically to c...
VIS
2004
IEEE
16 years 3 months ago
2004
IEEE
Most data used in the study of seafloor hydrothermal plumes consists of sonar (acoustic) scans and sensor readings. Visual data captures only a portion of the sonar data range due...
116
Voted
VISUALIZATION
1999
IEEE
15 years 6 months ago
1999
IEEE
Visualization of topological information of a vector field can provide useful information on the structure of the field. However, in turbulent flows standard critical point visual...

