416 search results - page 37 / 84 » Visual exploration of categorical and mixed data sets |
DEBU
2008
13 years 9 months ago
2008
Social media are constructed from the collective contributions of potentially millions of individuals and present an increasingly common and large scale form of database. As these...
INFOVIS
2002
IEEE
14 years 2 months ago
2002
IEEE
Many clustering and layout techniques have been used for structuring and visualising complex data. This paper is inspired by a number of such contemporary techniques and presents ...
BMCBI
2010
13 years 9 months ago
2010
Background: High-density tiling arrays and new sequencing technologies are generating rapidly increasing volumes of transcriptome and protein-DNA interaction data. Visualization a...
VIS
2005
IEEE
14 years 10 months ago
2005
IEEE
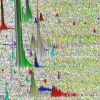
Differential protein expression analysis is one of the main challenges in proteomics. It denotes the search for proteins, whose encoding genes are differentially expressed under a...
IV
2009
IEEE
14 years 3 months ago
2009
IEEE
Computational simulation is an established method to gain insight into cellular processes. As the resulting data sets are usually large and complex, visualization can play a signi...


