416 search results - page 60 / 84 » Visual exploration of categorical and mixed data sets |
VISUALIZATION
1998
IEEE
14 years 6 days ago
1998
IEEE
This paper presents a new method for using texture to visualize multidimensional data elements arranged on an underlying threedimensional height field. We hope to use simple textu...
CVPR
2008
IEEE
14 years 10 months ago
2008
IEEE
The idea of representing images using a bag of visual words is currently popular in object category recognition. Since this representation is typically constructed using unsupervi...
SDM
2004
SIAM
13 years 9 months ago
2004
SIAM
Segmentation based on RFM (Recency, Frequency, and Monetary) has been used for over 50 years by direct marketers to target a subset of their customers, save mailing costs, and imp...
INFOVIS
2003
IEEE
14 years 1 months ago
2003
IEEE
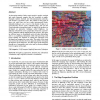
An increasing number of tasks require people to explore, navigate and search extremely complex data sets visualized as graphs. Examples include electrical and telecommunication ne...
ICASSP
2009
IEEE
14 years 2 months ago
2009
IEEE
For TV and radio shows containing narrowband speech, Speech-to-text (STT) accuracy on the narrowband audio can be improved by using an acoustic model trained on acoustically match...


