534 search results - page 12 / 107 » Visualizing chemical data in the internet - data-driven and ... |
VISUALIZATION
1995
IEEE
13 years 11 months ago
1995
IEEE
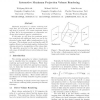
Maximum projection is a volume rendering technique that, for each pixel, finds the maximum intensity along a projector. For certain important classes of data, this is an approxim...
SIGGRAPH
1997
ACM
13 years 11 months ago
1997
ACM
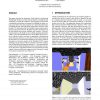
This paper describes the integration of the Berkeley Architectural Walkthrough Program with the National Institute of Standards and Technology’s CFAST fire simulator. The integ...
HCI
2007
13 years 9 months ago
2007
Information visualization is traditionally viewed as a tool for data exploration and hypothesis formation. Because of its roots in scientific reasoning, visualization has tradition...
CHI
2007
ACM
14 years 8 months ago
2007
ACM
Information shown on a tabletop display can appear distorted when viewed by a seated user. Even worse, the impact of this distortion is different depending on the location of the ...
EUROGRAPHICS
2010
Eurographics
14 years 2 months ago
2010
Eurographics
Higher-order finite element methods have emerged as an important discretization scheme for simulation. They are increasingly used in contemporary numerical solvers, generating a ...


