534 search results - page 42 / 107 » Visualizing chemical data in the internet - data-driven and ... |
SIGGRAPH
1994
ACM
14 years 28 days ago
1994
ACM
We demonstrate a physically-based technique for predicting the drape of a wide variety of woven fabrics. The approach exploits a theoretical model that explicitly represents the m...
INFOVIS
2005
IEEE
14 years 2 months ago
2005
IEEE
The discrete nature of categorical data makes it a particular challenge for visualization. Methods that work very well for continuous data are often hardly usable with categorical...
AVI
1998
13 years 10 months ago
1998
ABSTRACT. The paper presents SIAMOA, a system dedicated for design, debugging and visualisation of algorithms. It combines elements of an algorithm visualisation system and an envi...
INFOVIS
2003
IEEE
14 years 2 months ago
2003
IEEE
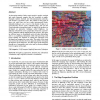
An increasing number of tasks require people to explore, navigate and search extremely complex data sets visualized as graphs. Examples include electrical and telecommunication ne...
VISUALIZATION
2000
IEEE
14 years 1 months ago
2000
IEEE
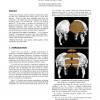
Visualization techniques enable scientists to interactively explore 3D data sets, segmenting and cutting them to reveal inner structure. While powerful, these techniques suffer fr...


