534 search results - page 45 / 107 » Visualizing chemical data in the internet - data-driven and ... |
IV
2002
IEEE
14 years 1 months ago
2002
IEEE
We describe a virtual reality widget library and two medical applications. These applications, built on the widget library, make use of collaborative interaction techniques. These...
VIP
2001
13 years 10 months ago
2001
Visualisation Systems are in general designed to maximise the cognitive ability of system users particularly when exposed to large sets of otherwise difficult to comprehend data, ...
VISUALIZATION
2000
IEEE
14 years 1 months ago
2000
IEEE
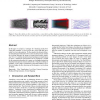
In this paper we propose a technique for visualizing steady flow. Using this technique, we first convert the vector field data into a scalar level-set representation. We then a...
CIKM
2006
Springer
14 years 18 days ago
2006
Springer
This paper presents an interactive visualization toolkit for navigating and analyzing the National Science Foundation (NSF) funding information. Our design builds upon an improved...
INFOVIS
2005
IEEE
14 years 2 months ago
2005
IEEE
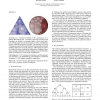
Treemaps are a well-known method for the visualization of attributed hierarchical data. Previously proposed Treemap layout algorithms are limited to rectangular shapes, which caus...


