98
Voted
APVIS
2008
15 years 2 months ago
2008
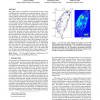
We propose a method to visually summarize collections of networks on which a clustering of the vertices is given. Our method allows for efficient comparison of individual networks...
105
Voted
APVIS
2008
15 years 2 months ago
2008
We present a new method for the visual analysis of multivariate system traces. Our method combines three perspectives: (1) a schematic diagram, (2) time series plots and (3) a sta...
95
Voted
APVIS
2010
15 years 2 months ago
2010
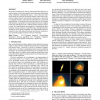
This paper presents visualization of field-measured, time-varying multidimensional earthquake accelerograph readings. Direct volume rendering is used to depict the space-time rela...
APVIS
2008
15 years 2 months ago
2008
APVIS
2008
15 years 2 months ago
2008
105
Voted
APVIS
2008
15 years 2 months ago
2008
We present a technique for memory-efficient and time-efficient volume rendering of curvilinear adaptive mesh refinement data defined within extrudable computational spaces. One of...
APVIS
2008
15 years 2 months ago
2008
Animation is frequently utilized to visually depict change in timevarying data sets. For this task, it is a natural fit. Yet explicit animation is rarely employed for static data....
100
click to vote
APVIS
2008
15 years 2 months ago
2008
Volume rendering of multiple intersecting volumetric objects is a difficult visualization task, especially if different rendering styles need to be applied to the components, in o...
ICCI
1991
15 years 4 months ago
1991
136
Voted
ICCI
1991
15 years 4 months ago
1991
The problem of coloring a set of n intervals (from the real line) with a set of k colors is studied. In such a coloring, two intersecting intervals must receive distinct colors. O...


