136
click to vote
INFOVIS
2003
IEEE
15 years 7 months ago
2003
IEEE
Large numbers of dimensions not only cause clutter in multidimensional visualizations, but also make it difficult for users to navigate the data space. Effective dimension manage...
120
click to vote
INFOVIS
2003
IEEE
15 years 7 months ago
2003
IEEE
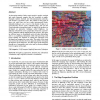
An increasing number of tasks require people to explore, navigate and search extremely complex data sets visualized as graphs. Examples include electrical and telecommunication ne...
INFOVIS
2003
IEEE
15 years 7 months ago
2003
IEEE
106
click to vote
INFOVIS
2003
IEEE
15 years 7 months ago
2003
IEEE
In this paper, we focus on some of the key design decisions we faced during the process of architecting a visualization system and present some possible choices, with their associ...
119
click to vote
INFOVIS
2003
IEEE
15 years 7 months ago
2003
IEEE
We present BARD (biological arc diagrams), a visualization tool for biological sequence analysis. The development of BARD began with the application of Wattenberg’s arc diagrams...
113
click to vote
INFOVIS
2003
IEEE
15 years 7 months ago
2003
IEEE
Unlike traditional information visualization, ambient information visualizations reside in the environment of the user rather than on the screen of a desktop computer. Currently, ...
100
click to vote
INFOVIS
2003
IEEE
15 years 7 months ago
2003
IEEE
In visualising multidimensional data, it is well known that different types of data require different types of algorithms to process them. Data sets might be distinguished accordi...
121
click to vote
INFOVIS
2003
IEEE
15 years 7 months ago
2003
IEEE
Data sets with a large number of nominal variables, some with high cardinality, are becoming increasingly common and need to be explored. Unfortunately, most existing visual explo...
INFOVIS
2003
IEEE
15 years 7 months ago
2003
IEEE
125
click to vote
INFOVIS
2003
IEEE
15 years 7 months ago
2003
IEEE
An algorithm is presented for the visualisation of multidimensional abstract data, building on a hybrid model introduced at InfoVis 2002. The most computationally complex stage of...


