132
click to vote
SOFTVIS
2010
ACM
15 years 2 months ago
2010
ACM
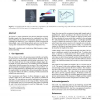
Previous techniques for visualizing time-series of multivariate data mostly plot the time along additional axes, are often complex, and does not support intuitive interaction. In ...
118
click to vote
SIGGRAPH
2010
ACM
15 years 6 months ago
2010
ACM
We present a visual exploration tool that lets biologists navigate through complex bat wing geometries by combining a novel modeling method and an interactive visualization approa...
113
click to vote
IV
2008
IEEE
15 years 8 months ago
2008
IEEE
Advances in the field of microarray technology have attracted a lot of attention in the last years. More and more biological experiments are conducted based on microarrays. The c...


