Free Online Productivity Tools
i2Speak
i2Symbol
i2OCR
iTex2Img
iWeb2Print
iWeb2Shot
i2Type
iPdf2Split
iPdf2Merge
i2Bopomofo
i2Arabic
i2Style
i2Image
i2PDF
iLatex2Rtf
Sci2ools
VIS
2008
IEEE
2008
IEEE
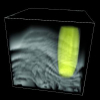
Continuous Scatterplots
Abstract--Scatterplots are well established means of visualizing discrete data values with two data variables as a collection of discrete points. We aim at generalizing the concept of scatterplots to the visualization of spatially continuous input data by a continuous and dense plot. An example of a continuous input field is data defined on an n-D spatial grid with respective interpolation or reconstruction of in-between values. We propose a rigorous, accurate, and generic mathematical model of continuous scatterplots that considers an arbitrary density defined on an input field on an n-D domain and that maps this density to m-D scatterplots. Special cases are derived from this generic model and discussed in detail: scatterplots where the n-D spatial domain and the m-D dataattribute domain have identical dimension, 1-D scatterplots as a way to define continuous histograms, and 2-D scatterplots of data on 3-D spatial grids. We show how continuous histograms are related to traditional di...
2-D Scatterplots | Continuous Scatterplots | IEEE Visualization | M-D Scatterplots | VIS 2008 | Visualization |
| Added | 03 Nov 2009 |
| Updated | 04 Nov 2009 |
| Type | Conference |
| Year | 2008 |
| Where | VIS |
| Authors | Sven Bachthaler, Daniel Weiskopf |
Comments (0)

