420 search results - page 4 / 84 » Graphical inference for infovis |
INFOVIS
2005
IEEE
14 years 4 months ago
2005
IEEE
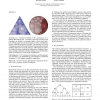
Treemaps are a well-known method for the visualization of attributed hierarchical data. Previously proposed Treemap layout algorithms are limited to rectangular shapes, which caus...
INFOVIS
2005
IEEE
14 years 4 months ago
2005
IEEE
Many visual analysis tools operate on a fixed set of data. However, professional information analysts follow issues over a period of time and need to be able to easily add new doc...
INFOVIS
2005
IEEE
14 years 4 months ago
2005
IEEE
Aggregating items can simplify the display of huge quantities of data values at the cost of losing information about the attribute values of the individual items. We propose a dis...
INFOVIS
2000
IEEE
14 years 3 months ago
2000
IEEE
By virtue of their spatio-cognitive abilities, humans are able to navigate through geographic space as well as meaningfully communicate geographic information represented in carto...
INFOVIS
1999
IEEE
14 years 3 months ago
1999
IEEE
We examine how animating a viewpoint change in a spatial information system affects a user's ability to build a mental map of the information in the space. We found that anim...


