454 search results - page 20 / 91 » Grid Monitoring and Data Visualization |
116
click to vote
CGF
2008
15 years 2 months ago
2008
In many business applications, large data workloads such as sales figures or process performance measures need to be monitored in real-time. The data analysts want to catch proble...
126
click to vote
CCS
2009
ACM
15 years 9 months ago
2009
ACM
A power grid is a complex system connecting electric power generators to consumers through power transmission and distribution networks across a large geographical area. System mo...
143
click to vote
DMSN
2006
ACM
15 years 8 months ago
2006
ACM
Modern data centers have a large number of components that must be monitored, including servers, switches/routers, and environmental control systems. This paper describes InteMon,...
139
click to vote
VVS
1996
IEEE
15 years 6 months ago
1996
IEEE
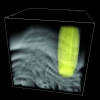
A critical issue in understanding high speed flows is the study of shock waves. This paper summarizes our research on techniques for the detection and visualization of shock waves...
103
Voted
VIS
2008
IEEE
16 years 3 months ago
2008
IEEE
Abstract--Scatterplots are well established means of visualizing discrete data values with two data variables as a collection of discrete points. We aim at generalizing the concept...


