454 search results - page 33 / 91 » Grid Monitoring and Data Visualization |
106
Voted
CG
2000
Springer
15 years 2 months ago
2000
Springer
Visualization of multi-dimensional data is a challenging task. The goal is not the display of multiple data dimensions, but user comprehension of the multi-dimensional data. This p...
115
Voted
VISSYM
2007
15 years 5 months ago
2007
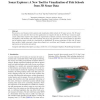
We present a novel framework for analysis and visualization of fish schools in 3D sonar surveys. The 3D sonar technology is new and there have not been applications to visualize t...
127
Voted
CG
2002
Springer
15 years 2 months ago
2002
Springer
Weather is one of the major causes of aviation accidents. General aviation (GA) flights account for 92% of all the aviation accidents. In spite of all the official and unofficial ...
IV
2002
IEEE
15 years 7 months ago
2002
IEEE
Box plot is a compact representation that encodes the minimum, maximum, mean, median, and quartile information of a distribution. In practice, a single box plot is drawn for each ...
332
Voted
SIGMOD
2006
ACM
16 years 2 months ago
2006
ACM
Given a dataset P and a preference function f, a top-k query retrieves the k tuples in P with the highest scores according to f. Even though the problem is well-studied in convent...


