362 search results - page 50 / 73 » Interactive 3D visualization of vector data in GIS |
TVCG
2008
13 years 8 months ago
2008
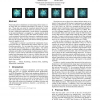
Scatterplots remain one of the most popular and widely-used visual representations for multidimensional data due to their simplicity, familiarity and visual clarity, even if they l...
VISUALIZATION
2003
IEEE
14 years 2 months ago
2003
IEEE
Numerical particle simulations and astronomical observations create huge data sets containing uncorrelated 3D points of varying size. These data sets cannot be visualized interact...
VISSYM
2004
13 years 10 months ago
2004
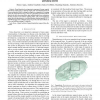
Climateprediction.net aims to harness the spare CPU cycles of a million individual users' PCs to run a massive ensemble of climate simulations using an up-to-date, full-scale...
VR
2002
IEEE
14 years 1 months ago
2002
IEEE
—Bone dissection is an important component of many surgical procedures. In this paper, we discuss a haptic and visual implementation of a bone cutting burr, that it is being deve...
SI3D
2003
ACM
14 years 2 months ago
2003
ACM
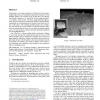
In this paper we develop an interactive 3D browser for large topographic maps using a visual display augmented by a haptic, or force feedback, display. The extreme size of our dat...


