226 search results - page 5 / 46 » Interactive deformation and visualization of large volume da... |
VIS
2008
IEEE
14 years 9 months ago
2008
IEEE
Parallel coordinate plots (PCPs) are commonly used in information visualization to provide insight into multi-variate data. These plots help to spot correlations between variables....
VISUALIZATION
2005
IEEE
14 years 1 months ago
2005
IEEE
Illustrations play a major role in the education process. Whether used to teach a surgical or radiologic procedure, to illustrate normal or aberrant anatomy, or to explain the fun...
VIS
2005
IEEE
14 years 9 months ago
2005
IEEE
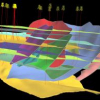
In this paper, we present a volume roaming system dedicated to oil and gas exploration. Our system combines probebased volume rendering with data processing and computing. The dai...
VIS
2009
IEEE
14 years 9 months ago
2009
IEEE
Confocal microscopy is widely used in neurobiology for studying the three-dimensional structure of the nervous system. Confocal image data are often multi-channel, with each channe...
ICTAI
2002
IEEE
14 years 20 days ago
2002
IEEE
Data mining is the process of extracting implicit, valuable, and interesting information from large sets of data. Visualization is the process of visually exploring data for patte...


