4059 search results - page 87 / 812 » Interactive visual dialog |
159
click to vote
VISSYM
2004
15 years 3 months ago
2004
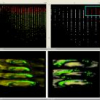
Figure 1: RBF reconstruction of unstructured CFD data. (a) Volume rendering of 1,943,383 tetrahedral shock data set using 2,932 RBF functions. (b) Volume rendering of a 156,642 te...
130
Voted
ICSE
2009
IEEE-ACM
15 years 9 months ago
2009
IEEE-ACM
Though there is a multitude of software modeling tools available, the handling of diagrams, which are an essential way of representation, is still difficult. To overcome these pr...
99
Voted
PG
2003
IEEE
15 years 7 months ago
2003
IEEE
Interactive visualization of complex, real-world light sources has so far not been feasible. In this paper, we present an hardware accelerated direct lighting algorithm based on a...
134
click to vote
INFOVIS
2005
IEEE
15 years 8 months ago
2005
IEEE
Many visual analysis tools operate on a fixed set of data. However, professional information analysts follow issues over a period of time and need to be able to easily add new doc...
123
Voted
VIS
2007
IEEE
16 years 3 months ago
2007
IEEE
Perfusion data are dynamic medical image data which characterize the regional blood flow in human tissue. These data bear a great potential in medical diagnosis, since diseases can...


