196 search results - page 18 / 40 » Multidimensional Visualization of Hemodynamic Data |
105
click to vote
APVIS
2010
15 years 4 months ago
2010
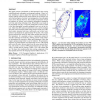
This paper presents visualization of field-measured, time-varying multidimensional earthquake accelerograph readings. Direct volume rendering is used to depict the space-time rela...
142
click to vote
INFOVIS
2003
IEEE
15 years 7 months ago
2003
IEEE
Large numbers of dimensions not only cause clutter in multidimensional visualizations, but also make it difficult for users to navigate the data space. Effective dimension manage...
117
click to vote
GECCO
2007
Springer
15 years 8 months ago
2007
Springer
Visualization of multidimensional data by means of Multidimensional Scaling (MDS) is a popular technique of exploratory data analysis widely usable, e.g. in analysis of bio-medica...
129
Voted
VISUALIZATION
1995
IEEE
15 years 6 months ago
1995
IEEE
Animportantgoalofvisualizationtechnologyistosupport the exploration and analysis of very large amounts of data. In this paper, we propose a new visualization technique called ‘r...
118
click to vote
BALT
2006
15 years 6 months ago
2006
Abstract. On Line Analytical Processing (OLAP) is a technology basically created to provide users with tools in order to explore and navigate into data cubes. Unfortunately, in hug...


