209 search results - page 15 / 42 » Multidimensional Visualization of Transition Systems |
131
click to vote
VIS
2005
IEEE
16 years 3 months ago
2005
IEEE
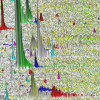
Differential protein expression analysis is one of the main challenges in proteomics. It denotes the search for proteins, whose encoding genes are differentially expressed under a...
105
Voted
APVIS
2010
15 years 3 months ago
2010
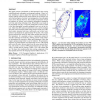
This paper presents visualization of field-measured, time-varying multidimensional earthquake accelerograph readings. Direct volume rendering is used to depict the space-time rela...
118
click to vote
KDD
2002
ACM
16 years 2 months ago
2002
ACM
In the last several years, large OLAP databases have become common in a variety of applications such as corporate data warehouses and scientific computing. To support interactive ...
138
Voted
DOLAP
2005
ACM
15 years 4 months ago
2005
ACM
OLAP users heavily rely on visualization of query answers for their interactive analysis of massive amounts of data. Very often, these answers cannot be visualized entirely and th...
116
click to vote
DAGSTUHL
2001
15 years 3 months ago
2001
Software visualization has been almost exclusively tackled from the visual point of view; this means visualization occurs exclusively through the visual channel. This approach has ...


