694 search results - page 31 / 139 » On the Dimensions of Data Complexity through Synthetic Data ... |
IVS
2002
13 years 8 months ago
2002
Glyphs are graphical entities that convey one or more data values via attributes such as shape, size, color, and position. They have been widely used in the visualization of data ...
KDD
2000
ACM
14 years 13 days ago
2000
ACM
Many organizations today have more than very large databases; they have databases that grow without limit at a rate of several million records per day. Mining these continuous dat...
CEC
2009
IEEE
14 years 3 months ago
2009
IEEE
This paper describes an evolutionary clustering algorithm, which can partition a given dataset automatically into the optimal number of groups through one shot of optimization. The...
SIAMSC
2008
13 years 8 months ago
2008
Model order reduction (MOR) is common in simulation, control and optimization of complex dynamical systems arising in modeling of physical processes and in the spatial discretizati...
APVIS
2010
13 years 3 months ago
2010
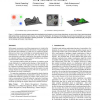
In this paper, we present a novel three-stage process to visualize the structure of point clouds in arbitrary dimensions. To get insight into the structure and complexity of a dat...


