1139 search results - page 54 / 228 » Rhythm modeling, visualizations and applications |
AICT
2006
IEEE
14 years 2 months ago
2006
IEEE
As the Web platform continues to mature, we see an increasing number of amazing technologies that take Geographic Information Systems (GIS) visualization applications to new level...
VIS
2004
IEEE
14 years 10 months ago
2004
IEEE
Most data used in the study of seafloor hydrothermal plumes consists of sonar (acoustic) scans and sensor readings. Visual data captures only a portion of the sonar data range due...
GRAPHICSINTERFACE
2004
13 years 10 months ago
2004
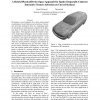
We propose a novel approach for a dense texture-based visualization of vector fields on curved surfaces. Our texture advection mechanism relies on a Lagrangian particle tracing th...
VIS
2004
IEEE
14 years 10 months ago
2004
IEEE
Coronary heart disease (CHD) is the number one killer in the United States. Although it is well known that CHD mainly occurs due to blocked arteries, there are contradictory resul...
VISUALIZATION
2005
IEEE
14 years 2 months ago
2005
IEEE
In this case study, a data-oriented approach is used to visualize a complex digital signal processing pipeline. The pipeline implements a Frequency Modulated (FM) Software-Defined...


