416 search results - page 56 / 84 » Visual exploration of categorical and mixed data sets |
DAGSTUHL
2001
13 years 9 months ago
2001
Computer science educators have traditionally used algorithm visualization (AV) software to create graphical representations of algorithms that are later used as visual aids in lec...
TRECVID
2007
13 years 9 months ago
2007
This paper describes the first participation of the SINAI1 group of the University of Ja´en in TRECVID 2007. We have only participated in the automatic search task. Our approach...
KDD
2012
ACM
11 years 10 months ago
2012
ACM
We present TOURVIZ, a system that helps its users to interactively visualize and make sense in large network datasets. In particular, it takes as input a set of nodes the user spe...
VIS
2004
IEEE
14 years 9 months ago
2004
IEEE
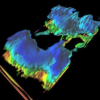
Feature detection in flow fields is a well researched area, but practical application is often difficult due to the numerical complexity of the algorithms preventing interactive u...
OSDI
2008
ACM
14 years 8 months ago
2008
ACM
Artemis is a modular application designed for analyzing and troubleshooting the performance of large clusters running datacenter services. Artemis is composed of four modules: (1)...


