1594 search results - page 21 / 319 » Visualizing Program Executions on Large Data Sets |
118
Voted
IV
2010
IEEE
15 years 26 days ago
2010
IEEE
We represent time-varying data as polyline charts very often. At the same time, we often need to observe hundreds or even thousands of time-varying values in one chart. However, i...
124
Voted
EGPGV
2004
Springer
15 years 7 months ago
2004
Springer
This paper presents I/O solutions for the visualization of time-varying volume data in a parallel and distributed computing environment. Depending on the number of rendering proce...
114
click to vote
BMCBI
2006
15 years 2 months ago
2006
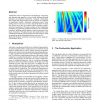
Background: Two-dimensional data colourings are an effective medium by which to represent three-dimensional data in two dimensions. Such "color-grid" representations hav...
103
click to vote
INFOVIS
2005
IEEE
15 years 8 months ago
2005
IEEE
The discrete nature of categorical data makes it a particular challenge for visualization. Methods that work very well for continuous data are often hardly usable with categorical...
130
click to vote
VISUALIZATION
2000
IEEE
15 years 6 months ago
2000
IEEE
Visualization can be an important tool for displaying, categorizing and digesting large quantities of inter-related information during laboratory and simulation experiments. Summa...


