138
click to vote
APVIS
2010
15 years 2 months ago
2010
Seismic horizons indicate change in rock properties and are central in geoscience interpretation. Traditional interpretation systems involve time consuming and repetitive manual v...
136
click to vote
APVIS
2010
15 years 3 months ago
2010
It is a difficult task to design transfer functions for noisy data. In traditional transfer-function spaces, data values of different materials overlap. In this paper we introduce...
126
Voted
APVIS
2009
15 years 3 months ago
2009
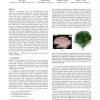
We present a correlation study of time-varying multivariate volumetric data sets. In most scientific disciplines, to test hypotheses and discover insights, scientists are interest...
144
click to vote
APVIS
2009
15 years 3 months ago
2009
In this paper, we present a novel adaptive visualization technique where the constituting polygons dynamically change their geometry and other visual attributes depending on user ...
122
click to vote
APVIS
2009
15 years 3 months ago
2009
Current visualization systems are typically based on the concept of interactive post-processing. This decoupling of data visualization from the process of data generation offers a...
137
click to vote
APVIS
2009
15 years 3 months ago
2009
Visualizing large-scale online social network is a challenging yet essential task. This paper presents HiMap, a system that visualizes it by clustered graph via hierarchical group...
119
click to vote
APVIS
2009
15 years 3 months ago
2009
Direct volume rendering is an important tool for visualizing complex data sets. However, in the process of generating 2D images from 3D data, information is lost in the form of at...
170
click to vote
APVIS
2009
15 years 3 months ago
2009
In this paper, we propose a stochastic simulation to model and analyze cellular signal transduction. The high number of objects in a simulation requires advanced visualization tec...
138
click to vote
APVIS
2009
15 years 3 months ago
2009
Many graph visualization systems use graph hierarchies to organize a large input graph into logical components. These approaches detect features globally in the data and place the...
142
click to vote
APVIS
2009
15 years 3 months ago
2009
Diffusion tensor fields reveal the underlying anatomical structures in biological tissues such as neural fibers in the brain. Most current methods for visualizing the diffusion te...
