APVIS
2006
15 years 2 months ago
2006
In cyber attack monitoring systems, various types of visualizations, such as geographical visualization, temporal visualization, logical visualization, are being used. Each visual...
104
Voted
APVIS
2006
15 years 2 months ago
2006
Performance and preference measures are commonly used in the assessment of visualization techniques. This is important and useful in understanding differences in effectiveness bet...
76
Voted
APVIS
2006
15 years 2 months ago
2006
This paper describes how to design a digital book for a new science called `Knowledge Science'. We prepare several types of navigation facilities for browsing the book. Speci...
APVIS
2006
15 years 2 months ago
2006
103
click to vote
APVIS
2006
15 years 2 months ago
2006
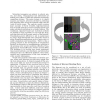
A multivariate network is a graph whose nodes contain multi-dimensional attributes. We propose a method to visualize such a network using spherical Self-Organizing Map (SOM) and c...
126
Voted
APVIS
2006
15 years 2 months ago
2006
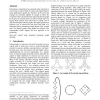
We study a variation of the boundary labelling problem, with floating sites (represented as polygons), labels of uniform size placed in fixed positions on the boundary of a rectan...
102
Voted
APVIS
2006
15 years 2 months ago
2006
Information visualization has attracted much attention in recent years in many fields of science and engineering. In many applications, graphs are `dynamic' in the sense that...
APVIS
2006
15 years 2 months ago
2006
In this paper, we present a method for simplification of arbitrary 3D meshes that is based on Isotropic Quantization of face-normal vectors. There are three stages. Firstly, a cod...
114
click to vote
APVIS
2006
15 years 2 months ago
2006
We have many application software today to support reading and writing respectively. However, we believe that few applications available today fully support both reading and writi...
104
Voted
APVIS
2006
15 years 2 months ago
2006
We propose a new method for representing tree structures with historical information. We call this method Ripple Presentation. Categories of nodes are represented by the angles of...
