108
Voted
APVIS
2007
15 years 2 months ago
2007
In this paper, we introduce a new method, GraphScape, to visualize multivariate networks, i.e., graphs with multivariate data associated with their nodes. GraphScape adopts a land...
101
click to vote
APVIS
2007
15 years 2 months ago
2007
In this paper, we present a case study for the visualisation and analysis of large and complex temporal multivariate networks derived from the Internet Movie DataBase (IMDB). Our ...
APVIS
2007
15 years 2 months ago
2007
: In this paper, we apply Particle-based Volume Rendering (PBVR) technique using a current programmable GPU architecture. Recently, the increasing programmability of GPU offers an ...
105
click to vote
APVIS
2007
15 years 2 months ago
2007
The level-of-detail techniques presented in this paper enable a comprehensible interactive visualization of large and complex clustered graph layouts either in 2D or 3D. Implicit ...
120
Voted
APVIS
2007
15 years 2 months ago
2007
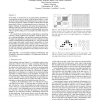
A straight-line grid drawing of a planar graph G is a drawing of G on an integer grid such that each vertex is drawn as a grid point and each edge is drawn as a straight-line segm...
APVIS
2007
15 years 2 months ago
2007
In this study, we examine the use of graph ordering algorithms for visual analysis of data sets using visual similarity matrices. Visual similarity matrices display the relationsh...
103
Voted
APVIS
2007
15 years 2 months ago
2007
Graphs are typically visualized as node-link diagrams. Although there is a fair amount of research focusing on crossing minimization to improve readability, little attention has b...
96
Voted
APVIS
2007
15 years 2 months ago
2007
In this paper, we consider the problem of navigating graphs drawn in 2.5 dimensions. First, we define criteria for good navigation and then present various methods to satisfy som...
139
click to vote
APVIS
2007
15 years 2 months ago
2007
Direct volume rendering of large volumetric data sets on programmable graphics hardware is often limited by the amount of available graphics memory and the bandwidth from main mem...
93
Voted
APVIS
2007
15 years 2 months ago
2007
Visual similarity matrices (VSMs) are a common technique for visualizing graphs and other types of relational data. While traditionally used for small data sets or well-ordered la...


