450 search results - page 72 / 90 » Predicting gene function by combining expression and interac... |
CGF
2008
13 years 8 months ago
2008
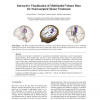
Teaser Figure: Left: Brain, visualized using silhouettes, the lesion's spatial depth is displayed using a ring. Center: Combined rendering of brain tissue, skull and fiber tr...
NAR
2011
12 years 11 months ago
2011
The Cervical Cancer gene DataBase (CCDB, http:// crdd.osdd.net/raghava/ccdb) is a manually curated catalog of experimentally validated genes that are thought, or are known to be i...
BMCBI
2008
13 years 8 months ago
2008
In studies that use DNA arrays to assess changes in gene expression, it is preferable to measure the significance of treatment effects on a group of genes from a pathway or functi...
BMCBI
2005
13 years 8 months ago
2005
Background: The most common method of identifying groups of functionally related genes in microarray data is to apply a clustering algorithm. However, it is impossible to determin...
BMCBI
2011
13 years 5 hour ago
2011
Background: Graphical models of network associations are useful for both visualizing and integrating multiple types of association data. Identifying modules, or groups of function...


