464 search results - page 68 / 93 » Visualization and VR for the Grid |
ACMSE
2010
ACM
13 years 6 months ago
2010
ACM
The Center for Remote Sensing of Ice Sheets (CReSIS) has been compiling Greenland ice sheet thickness data since 1993. The airborne program utilizes a 150 MHz radar echo sounder to...
CGA
2005
13 years 7 months ago
2005
Procedural encoding of scattered and unstructured scalar datasets using Radial Basis Functions (RBF) is an active area of research with great potential for compactly representing ...
ICRA
2009
IEEE
13 years 5 months ago
2009
IEEE
In Simultaneous Localisation and Mapping (SLAM), it is well known that probabilistic filtering approaches which aim to estimate the robot and map state sequentially suffer from poo...
VISSYM
2004
13 years 9 months ago
2004
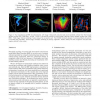
Figure 1: RBF reconstruction of unstructured CFD data. (a) Volume rendering of 1,943,383 tetrahedral shock data set using 2,932 RBF functions. (b) Volume rendering of a 156,642 te...
IJON
2007
13 years 7 months ago
2007
Inspired by optical recordings from visual cortex which show maps of orientation selectivity, and the finding that very similar patterns of population activity occur when the neu...


