534 search results - page 65 / 107 » Visualizing chemical data in the internet - data-driven and ... |
VISUALIZATION
2005
IEEE
14 years 2 months ago
2005
IEEE
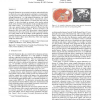
Scientific illustrations use accepted conventions and methodologies to effectively convey object properties and improve our understanding. We present a method to illustrate volum...
VISSYM
2004
13 years 10 months ago
2004
Climateprediction.net aims to harness the spare CPU cycles of a million individual users' PCs to run a massive ensemble of climate simulations using an up-to-date, full-scale...
CACM
2000
13 years 8 months ago
2000
In Programming by Example [PBE, also sometimes called "Programming by Demonstration"] systems, the system records actions performed by a user in the interface, and produ...
BMCBI
2006
13 years 9 months ago
2006
Background: Microarray technology has become a widely accepted and standardized tool in biology. The first microarray data analysis programs were developed to support pair-wise co...
VISUALIZATION
2005
IEEE
14 years 2 months ago
2005
IEEE
Existing parallel or remote rendering solutions rely on communicating pixels, OpenGL commands, scene-graph changes or application-specific data. We propose an intermediate soluti...


