127
click to vote
INFOVIS
2005
IEEE
15 years 7 months ago
2005
IEEE
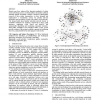
Many visual analysis tools operate on a fixed set of data. However, professional information analysts follow issues over a period of time and need to be able to easily add new doc...
105
click to vote
INFOVIS
2005
IEEE
15 years 7 months ago
2005
IEEE
Recent years have witnessed the dramatic popularity of online social networking services, in which millions of members publicly articulate mutual "friendship" relations....
120
click to vote
INFOVIS
2005
IEEE
15 years 7 months ago
2005
IEEE
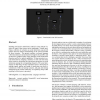
Time series are an important type of data with applications in virtually every aspect of the real world. Often a large number of time series have to be monitored and analyzed in p...
100
click to vote
INFOVIS
2005
IEEE
15 years 7 months ago
2005
IEEE
The discrete nature of categorical data makes it a particular challenge for visualization. Methods that work very well for continuous data are often hardly usable with categorical...
107
click to vote
INFOVIS
2005
IEEE
15 years 7 months ago
2005
IEEE
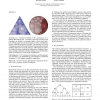
Treemaps are a well-known method for the visualization of attributed hierarchical data. Previously proposed Treemap layout algorithms are limited to rectangular shapes, which caus...
INFOVIS
2005
IEEE
15 years 7 months ago
2005
IEEE
Existing system-level taxonomies of visualization tasks are geared more towards the design of particular representations than the facilitation of user analytic activity. We presen...
109
click to vote
INFOVIS
2005
IEEE
15 years 7 months ago
2005
IEEE
We present the Visual Code Navigator, a set of three interrelated visual tools that we developed for exploring large source code software projects from three different perspective...
106
click to vote
INFOVIS
2005
IEEE
15 years 7 months ago
2005
IEEE
We present a novel visual correlation paradigm for situational awareness (SA) and suggest its usage in a diverse set of applications that require a high level of SA. Our approach ...
115
click to vote
SOFTVIS
2006
ACM
15 years 8 months ago
2006
ACM
It is vital for any developer to keep track of changes during his project. Thus, it is common practice to take static snapshots of single class diagrams. But to preserve the menta...
SOFTVIS
2006
ACM
15 years 8 months ago
2006
ACM
Enabling nonexperts to understand a software system and the scenarios of usage of that system can be challenging. Visually modeling a collection of scenarios as social interaction...


