121
click to vote
INFOVIS
2005
IEEE
15 years 7 months ago
2005
IEEE
The NameVoyager, a web-based visualization of historical trends in baby naming, has proven remarkably popular. This paper discusses the display techniques used for smooth visual e...
122
click to vote
INFOVIS
2005
IEEE
15 years 7 months ago
2005
IEEE
We present PRISAD, the first generic rendering infrastructure for information visualization applications that use the accordion drawing technique: rubber-sheet navigation with gu...
130
click to vote
INFOVIS
2005
IEEE
15 years 7 months ago
2005
IEEE
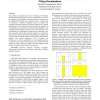
Space-filling visualizations, such as the TreeMap, are well-suited for displaying the properties of nodes in hierarchies. To browse the contents of the hierarchy, the primary mode...
105
Voted
INFOVIS
2005
IEEE
15 years 7 months ago
2005
IEEE
The most common approach to support analysis of graphs with associated time series data include: overlay of data on graph vertices for one timepoint at a time by manipulating a vi...
146
click to vote
INFOVIS
2005
IEEE
15 years 7 months ago
2005
IEEE
We present a system that allows users to interactively explore complex flow scenarios represented as Sankey diagrams. Our system provides an overview of the flow graph and allows ...
121
click to vote
INFOVIS
2005
IEEE
15 years 7 months ago
2005
IEEE
Cartographers have long used flow maps to show the movement of objects from one location to another, such as the number of people in a migration, the amount of goods being traded,...
INFOVIS
2005
IEEE
15 years 7 months ago
2005
IEEE
The general problem of visualizing “family trees”, or genealogical graphs, in 2D, is considered. A graph theoretic analysis is given, which identifies why genealogical graphs...
122
click to vote
INFOVIS
2005
IEEE
15 years 7 months ago
2005
IEEE
Parallel Coordinates are a powerful method for visualizing multidimensional data, however, with large data sets they can become cluttered and difficult to read. On the other hand...
114
click to vote
INFOVIS
2005
IEEE
15 years 7 months ago
2005
IEEE
Aggregating items can simplify the display of huge quantities of data values at the cost of losing information about the attribute values of the individual items. We propose a dis...
119
click to vote
INFOVIS
2005
IEEE
15 years 7 months ago
2005
IEEE
In order to gain insight into multivariate data, complex structures must be analysed and understood. Parallel coordinates is an excellent tool for visualizing this type of data bu...


