115
click to vote
INFOVIS
2000
IEEE
15 years 6 months ago
2000
IEEE
By virtue of their spatio-cognitive abilities, humans are able to navigate through geographic space as well as meaningfully communicate geographic information represented in carto...
115
click to vote
INFOVIS
2000
IEEE
15 years 6 months ago
2000
IEEE
This paper introduces a number of general methods for visualizing commonality in sets of text files. Each visualization simultaneously compares one file in the set to all other ...
INFOVIS
2000
IEEE
15 years 6 months ago
2000
IEEE
118
click to vote
INFOVIS
2000
IEEE
15 years 6 months ago
2000
IEEE
Data visualization environments help users understand and analyze their data by permitting interactive browsing of graphical representations of the data. To further facilitate und...
119
click to vote
INFOVIS
2000
IEEE
15 years 6 months ago
2000
IEEE
In previous work, researchers have attempted to construct taxonomies of information visualization techniques by examining the data domains that are compatible with these technique...
INFOVIS
2000
IEEE
15 years 6 months ago
2000
IEEE
Drawing on ethnographic studies of (landscape) architects at work, and interdisciplinary cooperation with them, this paper presents a human-centered approach to information visual...
107
click to vote
INFOVIS
2000
IEEE
15 years 6 months ago
2000
IEEE
Two tasks in Graph Visualization require partitioning: the assignment of visual attributes and divisive clustering. Often, we would like to assign a color or other visual attribut...
INFOVIS
2000
IEEE
15 years 6 months ago
2000
IEEE
Most work with geospatial data, whether for scientific analysis, urban and environmental planning, or business decision making is carried out by groups. In contrast, geographic vi...
INFOVIS
2000
IEEE
15 years 6 months ago
2000
IEEE
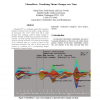
ThemeRiver™ is a prototype system that visualizes thematic variations over time within a large collection of documents. The “river” flows from left to right through time, ch...
INFOVIS
2000
IEEE
15 years 6 months ago
2000
IEEE
COMIND is a tool for conceptual design of industrial products. It helps designers define and evaluate the initial design space by using search algorithms to generate sets of feasi...
